
Introduction
Use the Test Center to quickly test your application is sending data to Nalpeiron servers correctly. You will be able to see a near real-time data flow between your client and the Nalpeiron server using this tool.
Go to the Nalpeiron Analytics Test Harness applications in this section if you wish to use our test example to get started.
Don't forget to setup your test harness (or your own app.) and have the custom library and all previous steps complete before using the test Center - If it's not all connected up to the correct "product" within your publisher center then you will not see any data in the console.
It's very easy to mistake actions on the client when testing, for example one of our testers had a mouse that kept double sending clicks and data that confused the team for a while!
Get Started
- To get started login as usual and click on "Setup your Product" on the product toolbar.
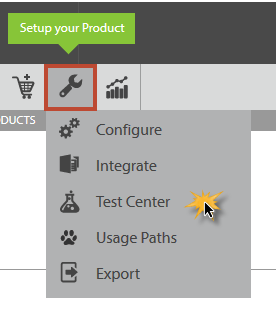
- Click on the "Test Center" option.
This will take you to the Test Center console ready to start receiving the data sent from your test client.
The console is very simple to operate but you may wish to review the links on the right hand side of the page to make sure you are all set, or if you have any issues you can see the FAQ related to using the console.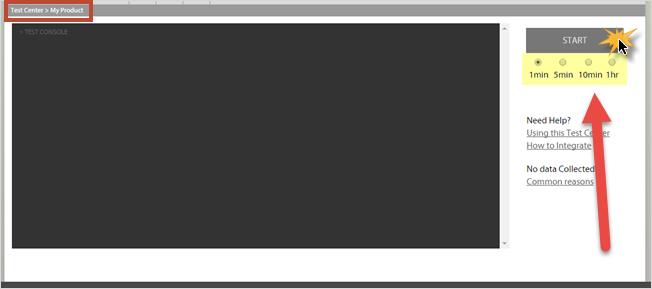
- Click on the "Start" button on the right of the console and set a time for the "listening" period you want the console to collect any incoming data.
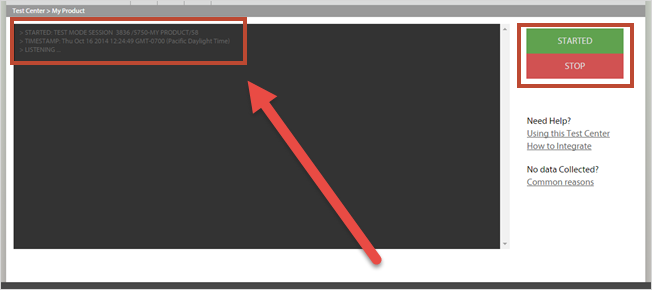
- You will now see the console screen on the left change and the buttons on the right too, they are now showing the status of "started" and allow you to stop the process with a new STOP button.
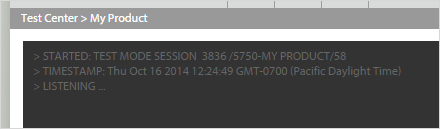
- The console screen is now displaying "listening..." so you should now switch to the client side and start your testing and sending up data.
An example of this is to use the Test Application (harness) and clicking around the UI to get various data points uploaded or use the command line to send data for C.

- Click on the "Stop" button anytime you want to stop the console receiving the data.
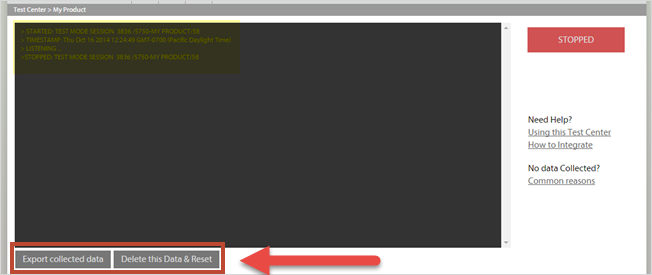
- Once you have stopped the collection, manually or after the set time period, you will be able to either export the collected data set or to start over.
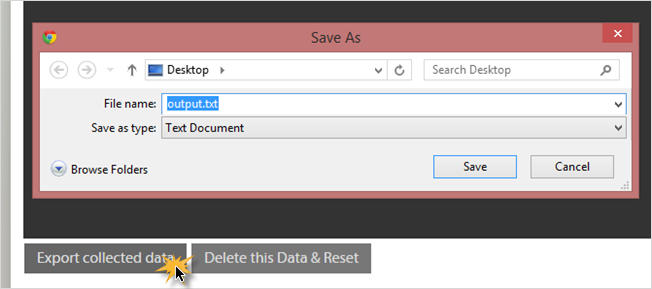
- Click on the "Export collected data" button at the bottom of the console to save a text file of this session. This can be helpful to compare to the test script on the client to ensure they match up.
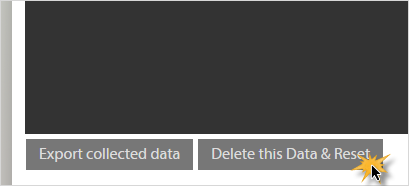
- Or you can click the "Delete this data & reset" button to reset the session and start over. Note that your data will only be saved if you exported it in the previous process so clicking this option will delete all your console data
Testing with the Test Harness and the Test center
Now we can go on to test with "live" data!
1 First navigate to the "Test Center" console page and set the time period to "listen", in this it's just a minute as it's a quick and easy test script we will show. Click the "Start" button.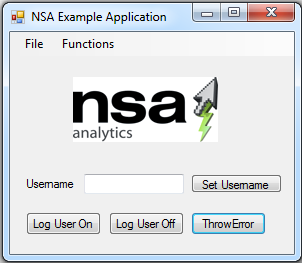
2 Next, open the test client app., in this case we are using the example Windows C# test application provided .
Also, it's good practice to have a test script set out in advance so you can be sure the actions taken on the client match those on the Server side. If you don't do this you will likely get unreliable results!
We will use the following simple test script on the client UI and then check that in the console to ensure we get the exact match between the actions in the UI and the data received.
Test Script
>Open test app.
Put a username "testuname" in the dialog box then press "Set Username"
>Then click:
- "Log User On" button
- "Log User Off" button
- ThrowError button
>Then Test Features:
- Click the "function" drop down menu on the top toolbar
- Click "Feature1" and then Features 2-5
>Close test app
Using the Test Console on the Server-side
3 Now let's review what got sent to the Nalpeiron Server.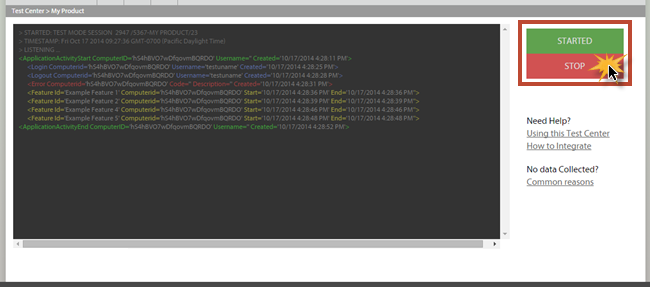
- First we can stop the console from listening now or wait for the minute to time out.
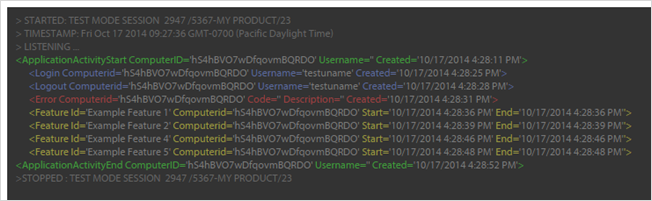
- Next we can review the console results that should be coming in in real-time.
Let's review the results on screen, you can see that the code is shown is a clean and easy to read "test syntax" so that you can compare the client/server data exchange simply.
You can see that the color coding makes it easy to check the various functions. The green text shows the application starting and ending and encapsulates the rest of the functionality we tested, blue for the Logon User On/Off; Red for the thrown error; Yellow for the features.
You can also see that exactly what we did in the script is replicated including the missing feature three test.
This means that we are all connected, exchanging the right data, and good to go!
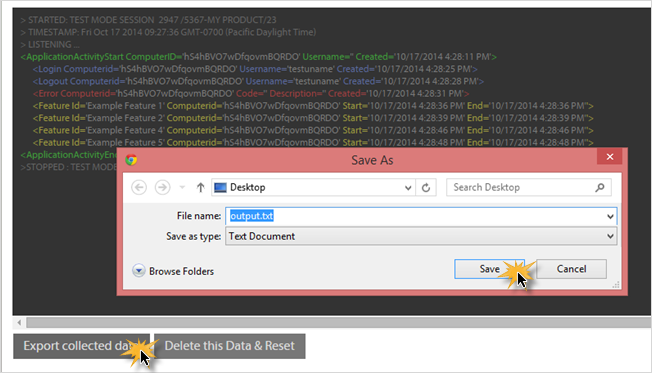
- We also think its good practice to save the log against each test process so you can see what happened each time, this gets more import the more complex and varied the data and tests you perform of course.
To save the log, click on the "Export collected data" button and save to your test PC as a text file.
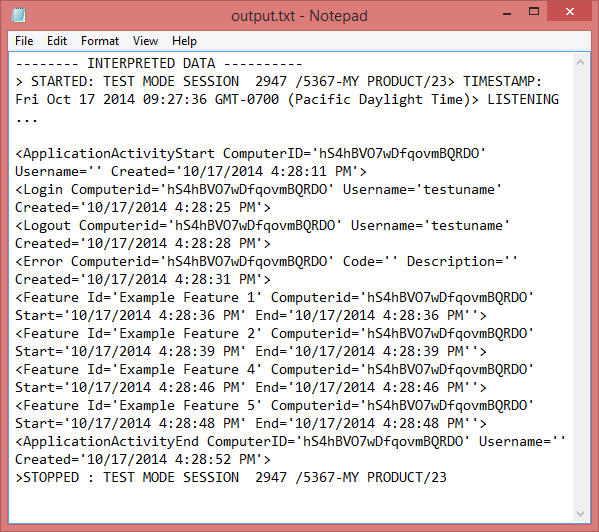
- Above is what our testing log looks like and as you can see it's timestamped, shows you which device sent the data and which "product" you are testing so you can then keep a solid record of the test process.