
Introduction
With reporting you can now see what's happening in the "wild". Once a product has been sold and licensed/activated little to no feedback is received back to the ISV ...it's a one-way street for data.
Great businesses are built around customer acquisition and retention, so you need an easy and reliable way to understand the customer in intimate detail. Now you can track your users easily. In order to get the real facts you need to go to the source and that only comes direct from the usage of the applications themselves fed back to you from some form of connected real-time analytics engine.
Track both anonymous and targeted users, across products, features, usage, adoption, location, platform, closed and lost sales and many more parameters - all with a few clicks Now you have your application setup and deployed you can start to run reports on the gathered Analytics Data for your Product(s). The standard fixed Nalpeiron reports are taken from your cached data and are fixed format to give you a quick snapshot of the data you have collected, you can then export the data and do more advanced charting and reporting on that data yourself and import it into 3rd party tools to do a better job of slicing and dicing it for your own unique needs.
You can easily export all of the categories we collect, or you can select only the categories you need.
Reporting on your data
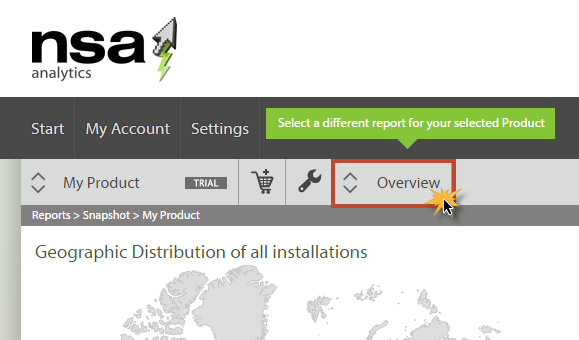
- To get started login as usual and click on "reports" on the product toolbar.
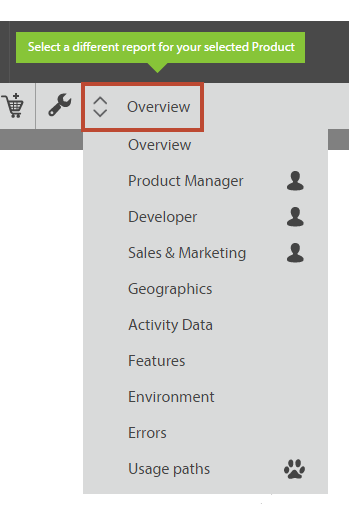
- Start by choosing the fixed report that is of interest to you. As you can see from the image there are a range of differing reports, some are broad and others focused by role. Each report is discussed below but should be self explanatory.
- On each report page you will note various charts and graphs displaying relevant data, also use the tabs to review data in time periods like day, week and month.
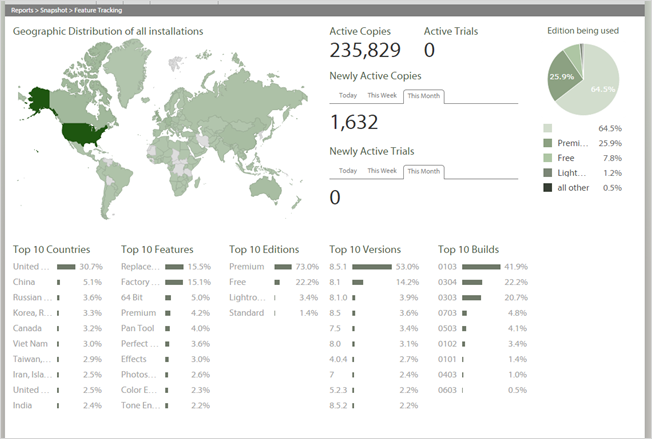
Report: Overview
The Overview report helps you eliminate wasted engineering by understanding feature usage. Use real "facts" not gut feelings to drive development. Spend development effort on the features people actually use, not what you “guess” they use. 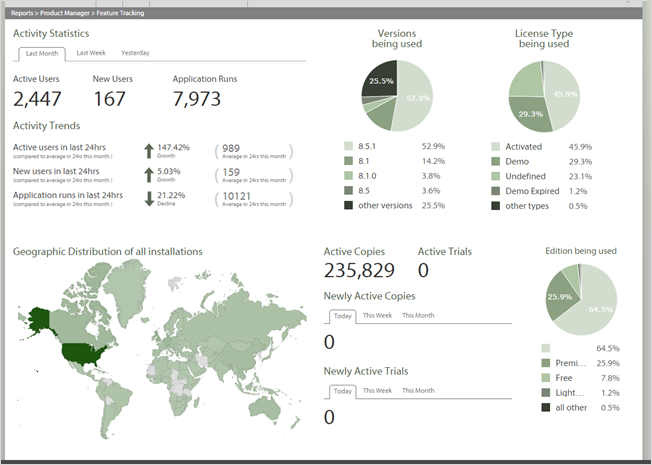
Report: Product Manager
This report helps understand your version deployment history to optimize product lifecycles. Use up to date version data from the field to drive decisions. See how popular each version of your application is and how important this version is comparing to the others. Are users switching to your newly released versions fast enough? How many users are stuck using an old build? Easily segment product versions, updates and editions and see adoption and failure rates for product quality improvements and reduce wasted engineering efforts. <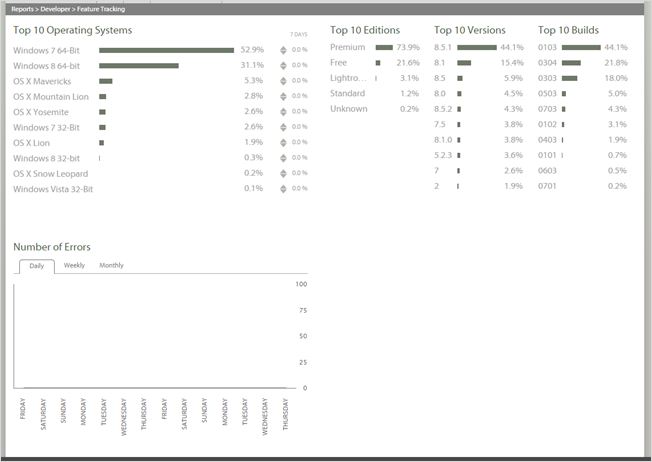
Report: Developer (engineering)
Develop for the most widely used platforms. Ensure your Software works on core platforms. Insight into your users' environments lets you support the technologies which really matter and allows you to develop your software to perform optimally on most of your installed base computers. Watch platforms trends and plan ahead. Understand the hardware, system configuration, platforms, operating systems and locale of users so you know how to target your new product engineering and end of life plans. <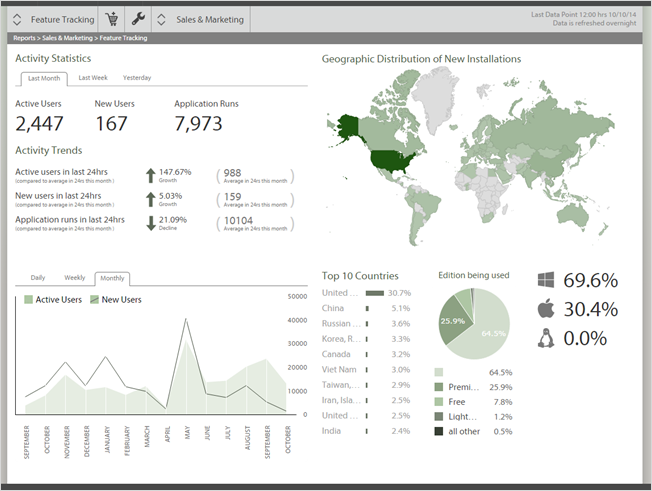
Report: Sales & Marketing
This report is more about user activity and adoption. Watch your new and active user rates over time to check on adoption levels for this product. Watch how new editions roll out or spikes in activity based on sales or marketing activity. See how your marketing messaging should be targeted based on regions, types of users and their environments. How well are your premium products being adopted vs. say free or lower cost versions?<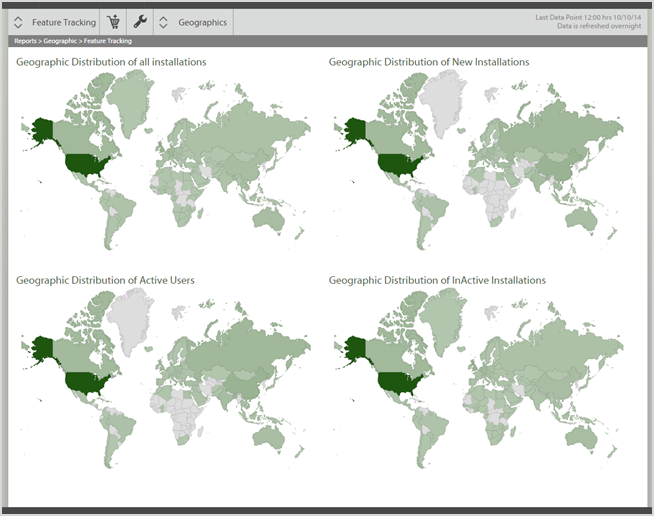
Report: Geographics
Target both your localization and marketing efforts by region. Know where all your User are located Worldwide. Easily visualize a complete analysis of your users based on their demographic information. The better you know your audience, the better you can create content to draw them in and increase your conversion rates. Target your Sales and Marketing Efforts effectively. In addition it's easier to plan your regional sales and marketing plans and localization needs with full understanding of your user base demographics.<
Report: Activity Data
Understand your user's activity so you can drive adoption levels. Understand core KPI at a glance. Knowing your installed base is a KPI you can't do without and it's a basic measure of your business health. The number of new users can be used to predict your businesses growth rate or to illustrate how your customer acquisition processes are performing. Easily see user activity trends. See the usage trends that are happening, break this down into different versions of your Software or even geographically to actually see the effect of marketing and sales happening around the world. <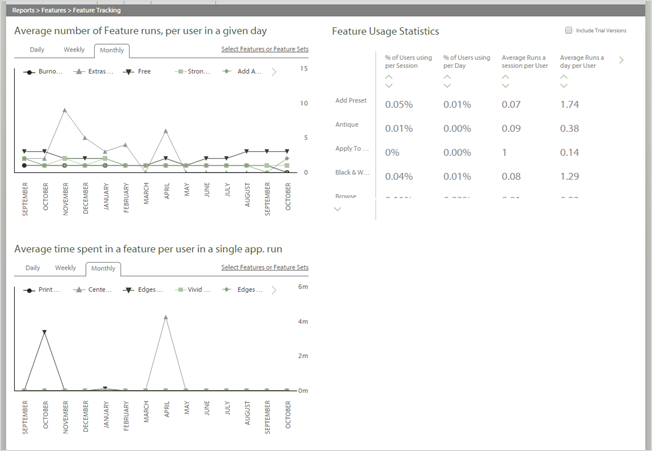
Report: Features
Understand how your apps are being consumed. See trends in certain features across all users. See how existing or new features are consumed by all your users over time, this enables you to see how well new features are received and pinpoint areas to focus training on or to make the new features more visible in your application. See feature usage by user. Track how often specific users consume features and pinpoint power users, or understand how features are consumed on a per user basis vs. the crowd. Different user groups will use the product in different ways and you can use this insight to target your application for optimum user adoption and satisfaction.<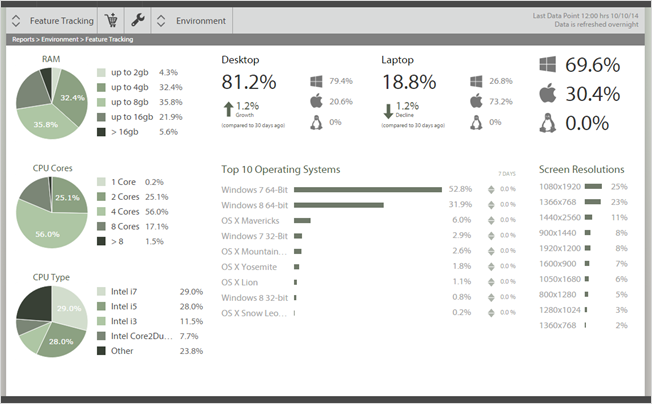
Report: Environment
Develop for the most widely used platforms. Ensure your Software works on core platforms. Insight into your users' environments lets you support the technologies which really matter and allows you to develop your software to perform optimally on most of your installed base computers. Watch platforms trends and plan ahead. Understand the hardware, system configuration, platforms, operating systems and locale of users so you know how to target your new product engineering and end of life plans. <
Report: Errors
Optimize Software quality, improve user satisfaction and reduce the support overhead Get ahead of the Technical Support Curve. Learn more about error conditions that might be caused by software defects or configuration issues to improve customer satisfaction and software quality. Gather data on exceptions, failures and problems with a full understanding of the system configurations allowing you to prioritize development to fix the most common/serious problems. Focus your support team on the key problems fast. Faster and more effective problem targeting leads to greater user satisfaction and lower support calls. Filtering down, you can ascertain whether errors are in specific versions or releases of your product or in combination with certain hardware or operating systems. <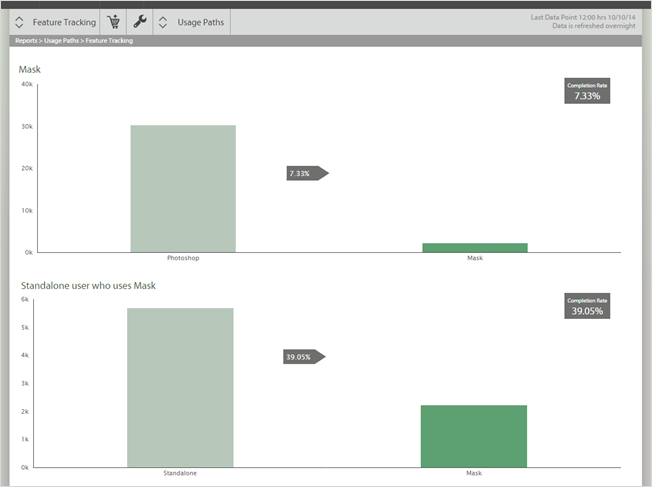
Report: Usage Paths
Setting up "usage paths" or the route your users take between features can be most helpful when planning your engineering or reviewing the usage of your applications in the wild - it's like a funnel analysis. Usage Path Charts show you the percentage of devices that use a feature of your Software that have also used other features.