
Introduction
Now you have your application setup you can start to analyze your data.Setting up "usage paths" or the route your users take between features can be most helpful when planning your engineering or reviewing the usage of your applications in the wild - it's like a funnel analysis. Usage Path Charts show you the percentage of devices that use a feature of your Software that have also used other features.
Before you use this functionality you will need to have specified "features" within your application and in the Publisher Center. See this article for details: "Setting up your Products in NSA".
Setting up Usage Path Charts
- To get started login as usual and click on "Setup your Product" on the product toolbar.
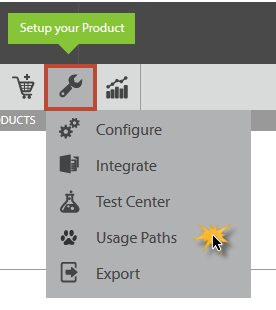
- Click on the "Usage Paths" option.
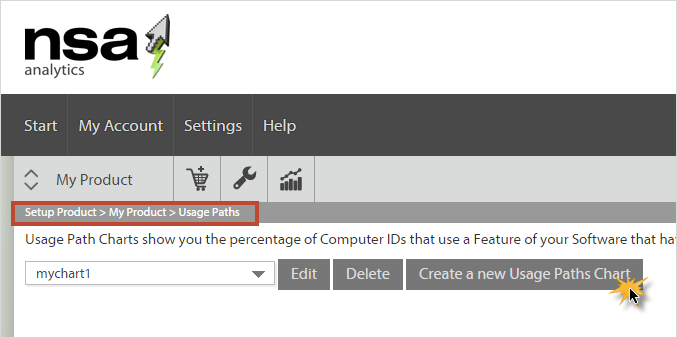
- Click on "create a new usage path report".
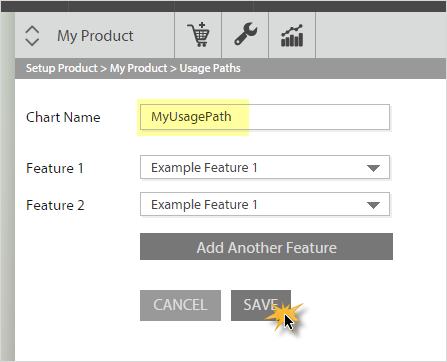
- Name the chart, and then choose the feature "path" you wish to report on. Select the first feature from the drop down list of the "features" you have already added to this "product" within the service and then the following ones, in this case choose a second one.
You will note there is a minimum of two features in a "path" report. You can add more but two or three would be a sensible limit.
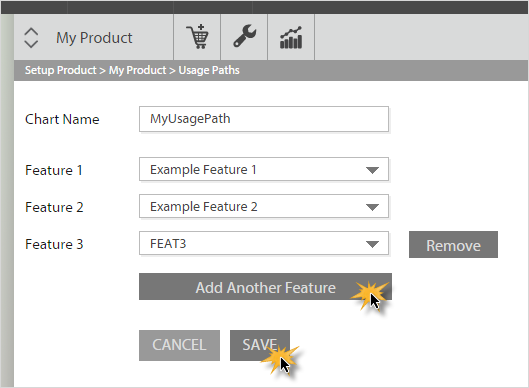
Adding another feature is as simple as clicking the "add another feature" button.
- Once you have selected the required features in the order you want the path to flow, click save.
Editing your Usage Path Reports
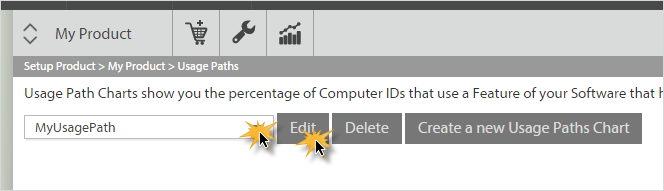
- You can also edit your Usage Path Reports by selecting them from the drop down dialog box and then clicking edit.
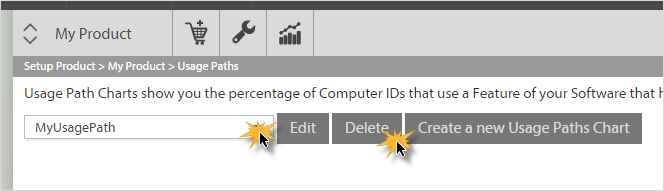
- You can delete your Usage Path reports by selecting them from the drop down dialog box and then clicking edit.
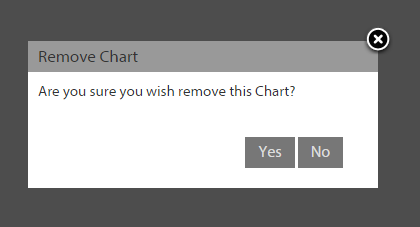
Once you remove the chart you cannot get it back so be careful when deleting reports.
Reviewing Chart Data
To review the results from your charts we will assume you have setup your applications with the required features, you have deployed them and now have sufficient users sending you data to make the reports useful to you.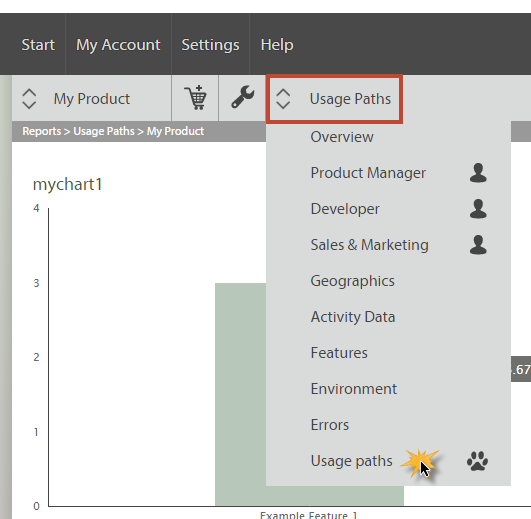
- Navigate to the "Reports" drop down list on there product toolbar
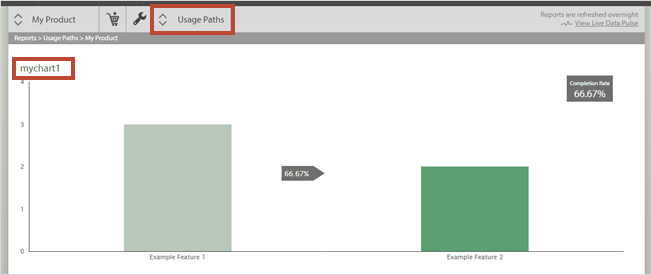
- The report will now list all your Usage Paths setup in the system for this specific product, this could be a number not just one. Each chart in the report will show you the data for the one's setup in the list with the name in the top left corner of the chart.